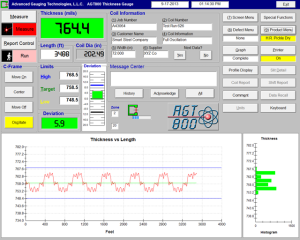
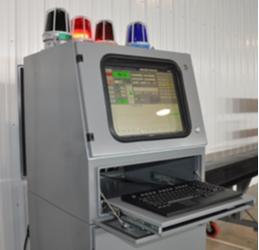
During normal operation, an interactive display shows real-time graphical representations of measured thickness, deviation, and a histogram of thickness values for the current coil. Also displayed are thickness, target, upper and lower tolerance limits, job number, coil number, shutter status, coil footage, coil width, defects if selected, product, and much more. Additional display screens are provided for next coil data, strip profile (thickness versus width), product setup, defect setup, report setup, calibration, diagnostics, message review, and data recall.
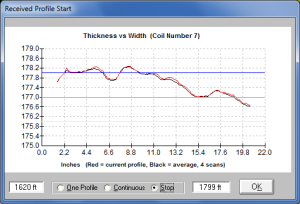
 The strip thickness profile (available with the oscillating C-frame) will show the material thickness across the width of the strip. This can be set to capture a single profile scan or continuously as the sheet is processed. The graphical representation will show the last scan against the average. The average or last scan is included on the coil report.
Accurate and Detailed Data
The reports generated by the A.G.T. software present a chart of strip thickness over the coil length, in strip chart fashion, and indicates location of out of tolerance material. In addition, this report presents a histogram of thickness distribution, footage, weight, average thickness, UCL, LCL, UTL, LTL, X Double Bar, R Bar, Cp, Cpk, and CR. This entire report is automatically scaled to fit on a single page, allowing for more organized record-keeping. Each coil’s data is available to load into a spread sheet or third party SPC program.
System Integration
Auto Data Gathering can automatically position the C-frame and start the measurement and reporting function. Auto Data Entry can be used to automatically enter coil data from your business system. Using both functions simultaneously, the A.G.T. thickness gauge can run itself with no operator intervention. Our system is fully capable of network data storage, in addition to remote printing and control.
S.P.C. Reports
- Defect Summary – Presents a period summary of production, available automatically at regularly scheduled times, or on demand.
- Shift Summary – Presents a period summary of production, available automatically at regularly scheduled times, or on demand.
- ISOcheck™ Report – This routine allows the gauge to check its own calibration over a range of samples or internal samples on the AGT400. This report can be sent to the system printer, allowing for regular system performance checks, and the related documentation to keep you in compliance with quality requirements.
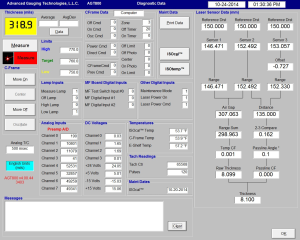
- Diagnostic Data Report – This report is actually a printout of the Diagnostic Data screen. It shows the real-time statue of all digital and analog I/O, nominal and actual internal sample readings, pre-amp and power supply voltages, and much more. Most of the major test points in the system are displayed simultaneously, making troubleshooting a very straightforward process. This page can easily be printed and faxed to Advanced Gauging Technologies for troubleshooting assistance.
Ease of Maintenance
Advanced Gauging Technologies is a service oriented company, and for that reason we are proud that all our thickness gauges have incredibly useful built-in diagnostic features. The Diagnostic Data Screen shows the real-time status of all thickness gauge functions including digital and analog I/O, nominal and actual power supply voltages, and much more. All the major test points in the system are displayed simultaneously, making troubleshooting a very straightforward process. This screen can easily be printed and emailed or faxed to A.G.T. for troubleshooting assistance.


